

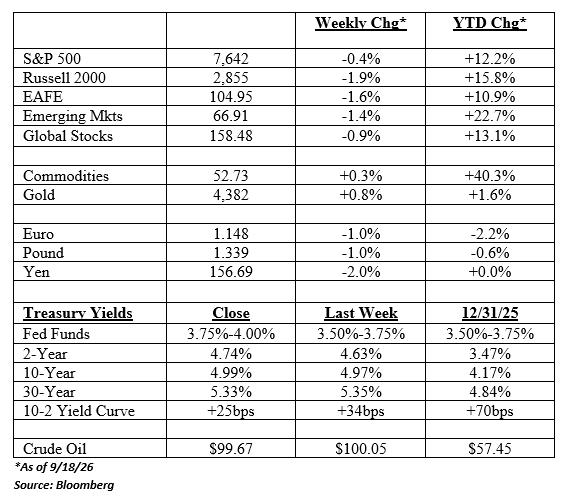
For all the angsts heading into the Fed meeting this week, the market’s reaction was relatively muted, all things considered. The main equity indexes didn’t move much for the week while bond yields drifted within a pretty narrow band. Even the move in oil/gasoline/diesel prices hasn’t had much of an impact on the broader market. Surprisingly, oil stocks lagged the broad index significantly this week. The only larger-than-normal swings took place in the currency markets.
The key points from the Fed meeting were as follows:
1) The decision was a unanimous 12-0 vote. Fed Chair Kevin Warsh pointed to three developments since July that brought the Committee together: stronger economic growth, insufficient improvement in inflation, and increased geopolitical risks.
2) Inflation remains the Fed’s predominant concern. Warsh said, “inflation is too high and has been for too long” and that the Fed’s “predominant focus is on the price stability side of our mandate.”
Jim Bianco used the chart below this week to show how long it has been since inflation was at the Fed’s target. Basically, everything changed when COVID struck.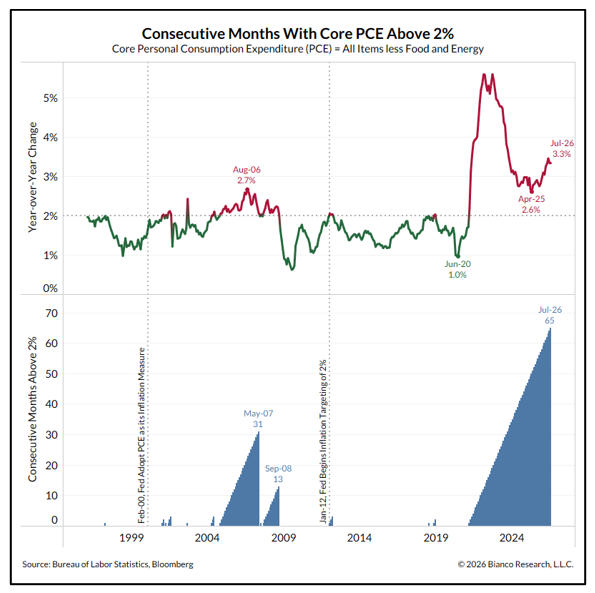
3) The Fed committee is bullish on the U.S. economy. Warsh repeatedly emphasized that the “American economy appears to be strengthening,” pointing to improving hiring, private-sector earnings, business capital investment, and robust credit flows.
On this point, it's actually staggering how resilient growth has been despite the energy shock. The chart below shows the Atlanta Fed’s estimate for third-quarter real growth (top line). Something with even a four handle would be a big number. 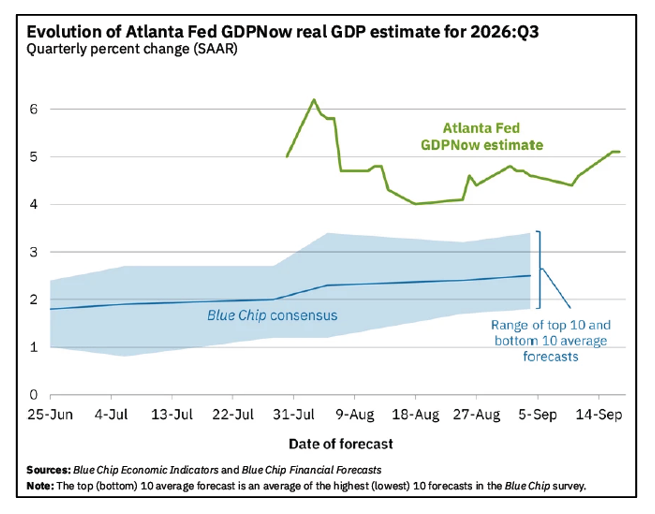
4) During the press conference, Warsh described the hike as removing “a dose of accommodation.”
This was an interesting turn of phrase that implies a couple of things. First, it means that Warsh and/or the committee think rates are still below the so-called neutral rate.
Second, it was interpreted by many to mean that this hike is simply starting to remove the stimulus added when former Fed Chair Powell cut rates three times in late 2025. This could imply an intention to remove all the rate cuts that took place between September and December 2025. This would get the Fed Funds rate back to between 4.25% and 4.50%.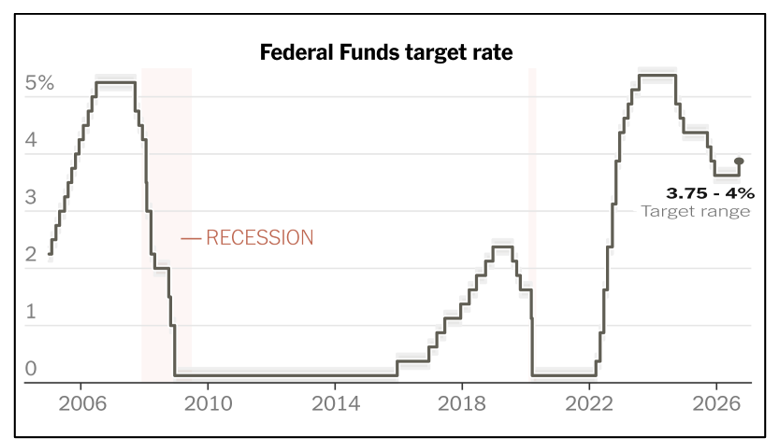
So, what to expect? Probably one more hike this year as long as the oil shock doesn’t get worse. Then the arm wrestling will begin about next year’s outlook. MRB, for one, thinks we see a series of hikes in 2027:
“Looking to next year, the bottom-line is that inflation will remain elevated for as long as the economy remains strong, and this in turn will continue to keep long-term bond yields elevated. The longer that the Fed remains behind the inflation curve (i.e. is slow to normalize policy) the upside risks to bond yields will continue. We expect that bond investors will force the Fed to hike further next year, in contrast with the new dot plot.”
(Other) Charts We Found Interesting
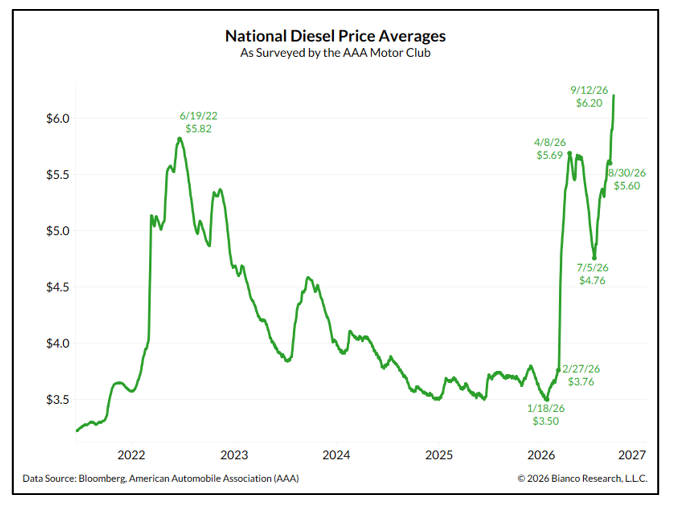
- A big question for next year’s inflation outlook is how much of the surge in diesel prices will feed through into general price pressures. This week, JP Morgan’s commodities team said out loud what many think: “For the first time since the start of the Iran conflict, we don’t have a baseline view. We simply don’t know how to model the endgame.”
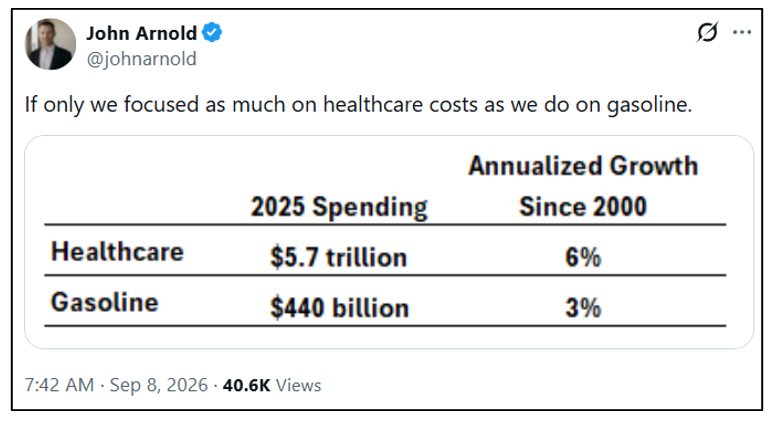
- This is an interesting take from John Arnold.
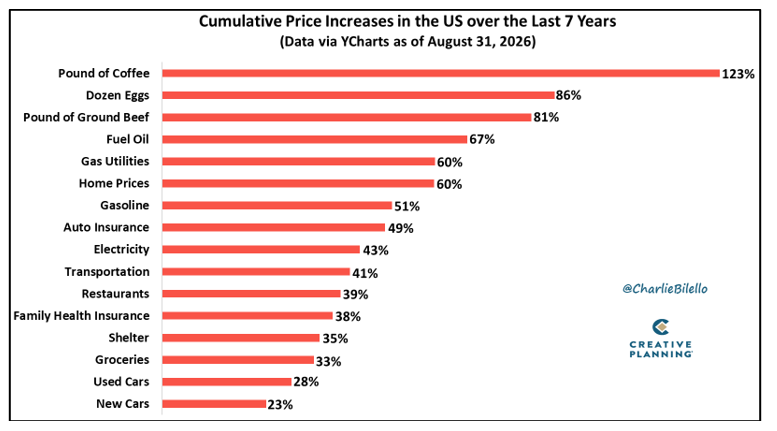
- Despite the increase, I might give up my healthcare before I give up my coffee.
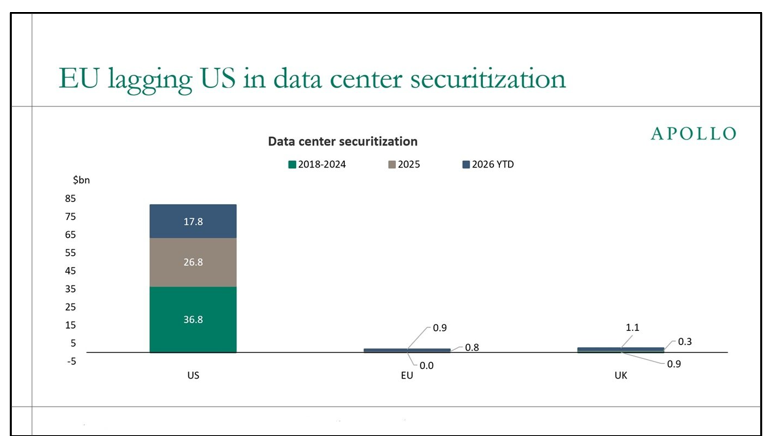
- From Will Mandidis on Thursday: “…it’s still so underrated the degree to which our intelligence supercycle was as much reliant on innovations in capital formation as it was innovations in the technology itself…Europe is losing not only because they can't build it, but primarily because they can't finance it!!”
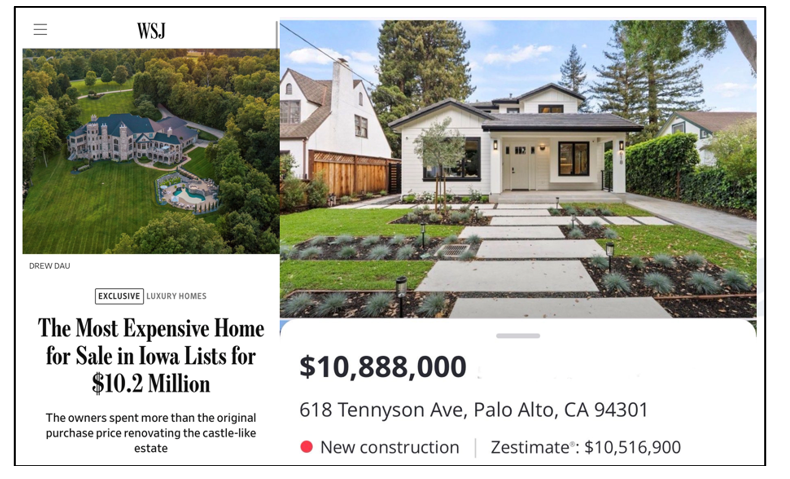
- The AI boom in the Bay Area is doing what previous tech booms have done – push home prices into the stratosphere!!
Have a good weekend
Charles Blankley
Published by Gemmer Asset Management LLC. The material presented (including all charts, graphs and statistics) is based on current public information that we consider reliable, but we do not represent it is accurate or complete, and it should not be relied on as such. The material is not an offer to sell or the solicitation of an offer to buy any security in any jurisdiction where such an offer or solicitation would be illegal. It does not constitute a personal recommendation or take into account the particular investment objective, financial situations, or needs of individual clients. Clients should consider whether any advice or recommendation in this material is suitable for their particular circumstances and, if appropriate, see professional advice, including tax advice. The price and value of investments referred to in this material and the income from them may fluctuate. Past performance is not a guide to future performance, future returns are not guaranteed, and a loss of original capital may occur. Fluctuations in exchange rates could have adverse effects on the value or prices of, or income derive from, certain investments. No part of this material may be (i) copied, photocopied, or duplicated in any form by any means or (ii) redistributed without the prior written consent of Gemmer Asset Management LLC (GAM). Any mutual fund performance presented in this material are used to illustrate opportunities within a diversified portfolio and do not represent the only mutual funds used in actual client portfolios. Any allocation models or statistics in this material are subject to change. GAM may change the funds utilized and/or the percentage weightings due to various circumstances. Please contact GAM, your advisor or financial representative for current inflation on allocation, account minimums and fees. Any major market indexes that are presented are unmanaged indexes or index-based mutual funds commonly used to measure the performance of the US and global stock/bond markets. These indexes have not necessarily been selected to represent an appropriate benchmark for the investment or model portfolio performance, but rather is disclosed to allow for comparison to that of well known, widely recognized indexes. The volatility of all indexes may be materially different from that of client portfolios. This material is presented for informational purposes. We maintain a list of all recommendations made in our allocation models for at least the previous 12 months. If you would like a complete listing of previous and current recommendations, please contact our office.